Making Sense of A/B Test Statistics

Alright, last time we chatted about server-side implementations (here’s the post if you missed it!). I started that article off talking about how difficult it is to truly understand the meaning behind the words. Server-side means different things to different people in different contexts. So, we then went towards a common baseline definition of understanding what we were talking about. The same can be said about the definitions, or the meanings, behind the A/B testing statistics that your Director of Optimization just presented to you. However, I know some of you either dreaded or slept through Statistics classes, or both! It’s not an easy topic to learn about or to communicate easily. Let’s attempt to change this, at least with a few of the super important statistical principles. After all, you know someone in your next Board Meeting or Executive Meeting will ask about it as it never fails!
I am going to share a tool with you that will not only make it much easier for you to understand these complicated A/B statistics terms, it will also enable you to easily and effectively communicate this information both internally and externally. It will keep your senior management team engaged in what you are saying, and that is huge. And, it’s a tool that’s been around for a long time. It is storytelling. These stories, that you can easily come up with, will also make it easier for you to define the terms for your Board Members or Executive peers when they ask questions around your A/B testing results. The key behind all of this is to choose a topic, say dogs, that is fun and commonly understood. And the really cool part about this is that the subject(s) of your story does not have to be business related!

Let’s use the term Confidence Interval as a case study in how easily it is to use stories to effectively communicate difficult terms. It’s an extremely important concept in A/B testing. So, first things first, if this term is new to you and you are not receiving that data for confidence intervals from A/B testing program group, then have a discussion on how it can be incorporated going forward. In A/B testing terms, the confidence interval is how much variation we would expect our A/B testing metric to show if we were to push the winning test variation live. That metric could be conversion rate, click through rate, article meter count, etc. So, that definition seems fairly straightforward, doesn’t it? However, I have experienced senior meetings where someone didn’t get it, and then all hell broke loose in the meeting and eventually people started to question the validity of the data and the A/B testing program!! Sounds crazy, I know, but it happens. Let’s look at another way of explaining confidence intervals.
My dog’s name is Finn. He is a 100 pound sweetheart of a Rottweiler. Let’s say your dog’s name is Luna. Luna is a fast 70 pound Golden Retriever. We decide to take both Finn and Luna out to a nice open field to play together. However, you and I are both very competitive so we make a game out of it. We are going to measure the success rate for each dog to retrieve the thrown ball and bring it back it’s right owner. The winning dog will be entered into the upcoming local Best Dog Games in the Category of Best Fetcher. So we really need to get this right to have our best chance of winning the blue ribbon at the games. You vaguely recall the idea of sample size from Stats class, so it makes sense to you when I say let’s throw 100 balls to each dog to get enough sample size measurements for the return %. Here are the results, and it appears on the surface at least that Finn is the clear winner as he returns 90% of his throws and Luna returns 83% of hers.

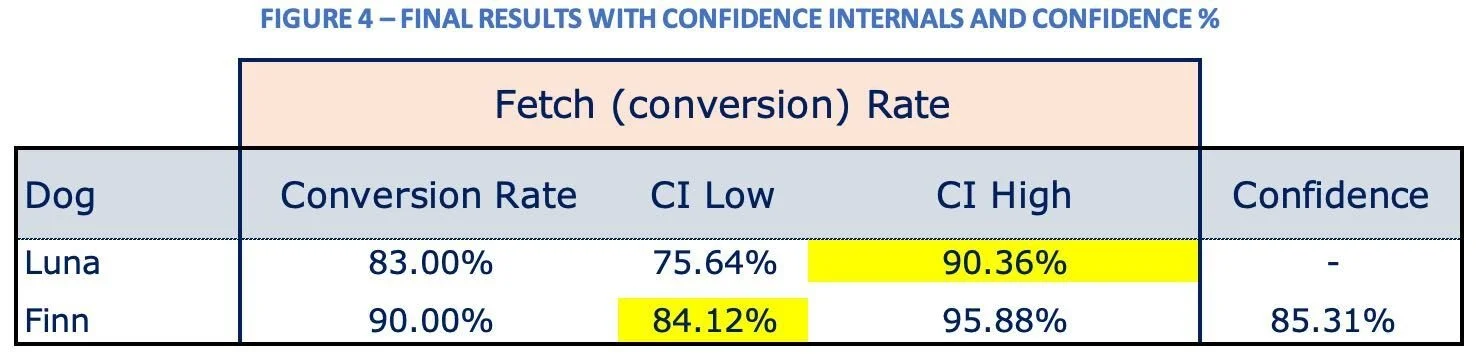
But remember, we really want to be sure that we enter the right dog into the Games. Let’s dig a little deeper with the data to ensure we have our best shot at winning the blue ribbon. This is when confidence intervals will help us make a more informed decision based upon statistics. You can see two visuals below, both of which we use with our clients in helping them with their optimization programs. The confidence intervals for each dog are show below, both in numbers and visually in the graph. We are interested in any overlap that may be occurring between Finn’s low side confidence value and Luna’s high side confidence value. Those numbers are 84.12% and 90.36% respectively and highlighted in yellow below. You’ll see that Luna’s high side Fetch Rate is higher than Finn’s low side Fetch Rate. You can see this in the yellow highlighted box in the Fetch Rate graph. So now we are starting to question our initial decision a bit. Our “confidence,” no pun intended, in the data has decreased and now we are not so sure which dog to enter into the Games.


So, where do we go next? How can we feel better about our decision? Now we will look at the Confidence % of this data. In other words, how confident are we that the results we experienced in our 100 training throws will be the same as when we enter our dog in the upcoming Dog Games? We are 85.31% confident in our decision to enter Finn into the Dog Games to bring home the blue ribbon! So at this point, it becomes somewhat of a judgement call. Is 85% good enough for us? Do we feel good about entering Finn into the Dog Games now? It’s quite possible. However, if we wanted to be super confident in our decision, we would like to see that confidence number be at least 95%. When the confidence number is 95% or above, you will see very little overlap between the confidence intervals show here.
95% confidence is a nice benchmark to use for your client’s Optimization program. In A/B testing terms, the confidence % of the test result is used to call a test a “winner” or not, and it refers to the likelihood that we will see the same results if we push this test experience live to all traffic. Typically, a 95% confidence level is used to make this decision. I have worked with some clients who will bump that down to 90% and make a “business decision” at that point. This is not a recommended practice but sometimes needs to be done from a timing or sample size perspective. Although you may have more test “winners,” you are increasing the level of risk to the business by dropping the confidence level down.
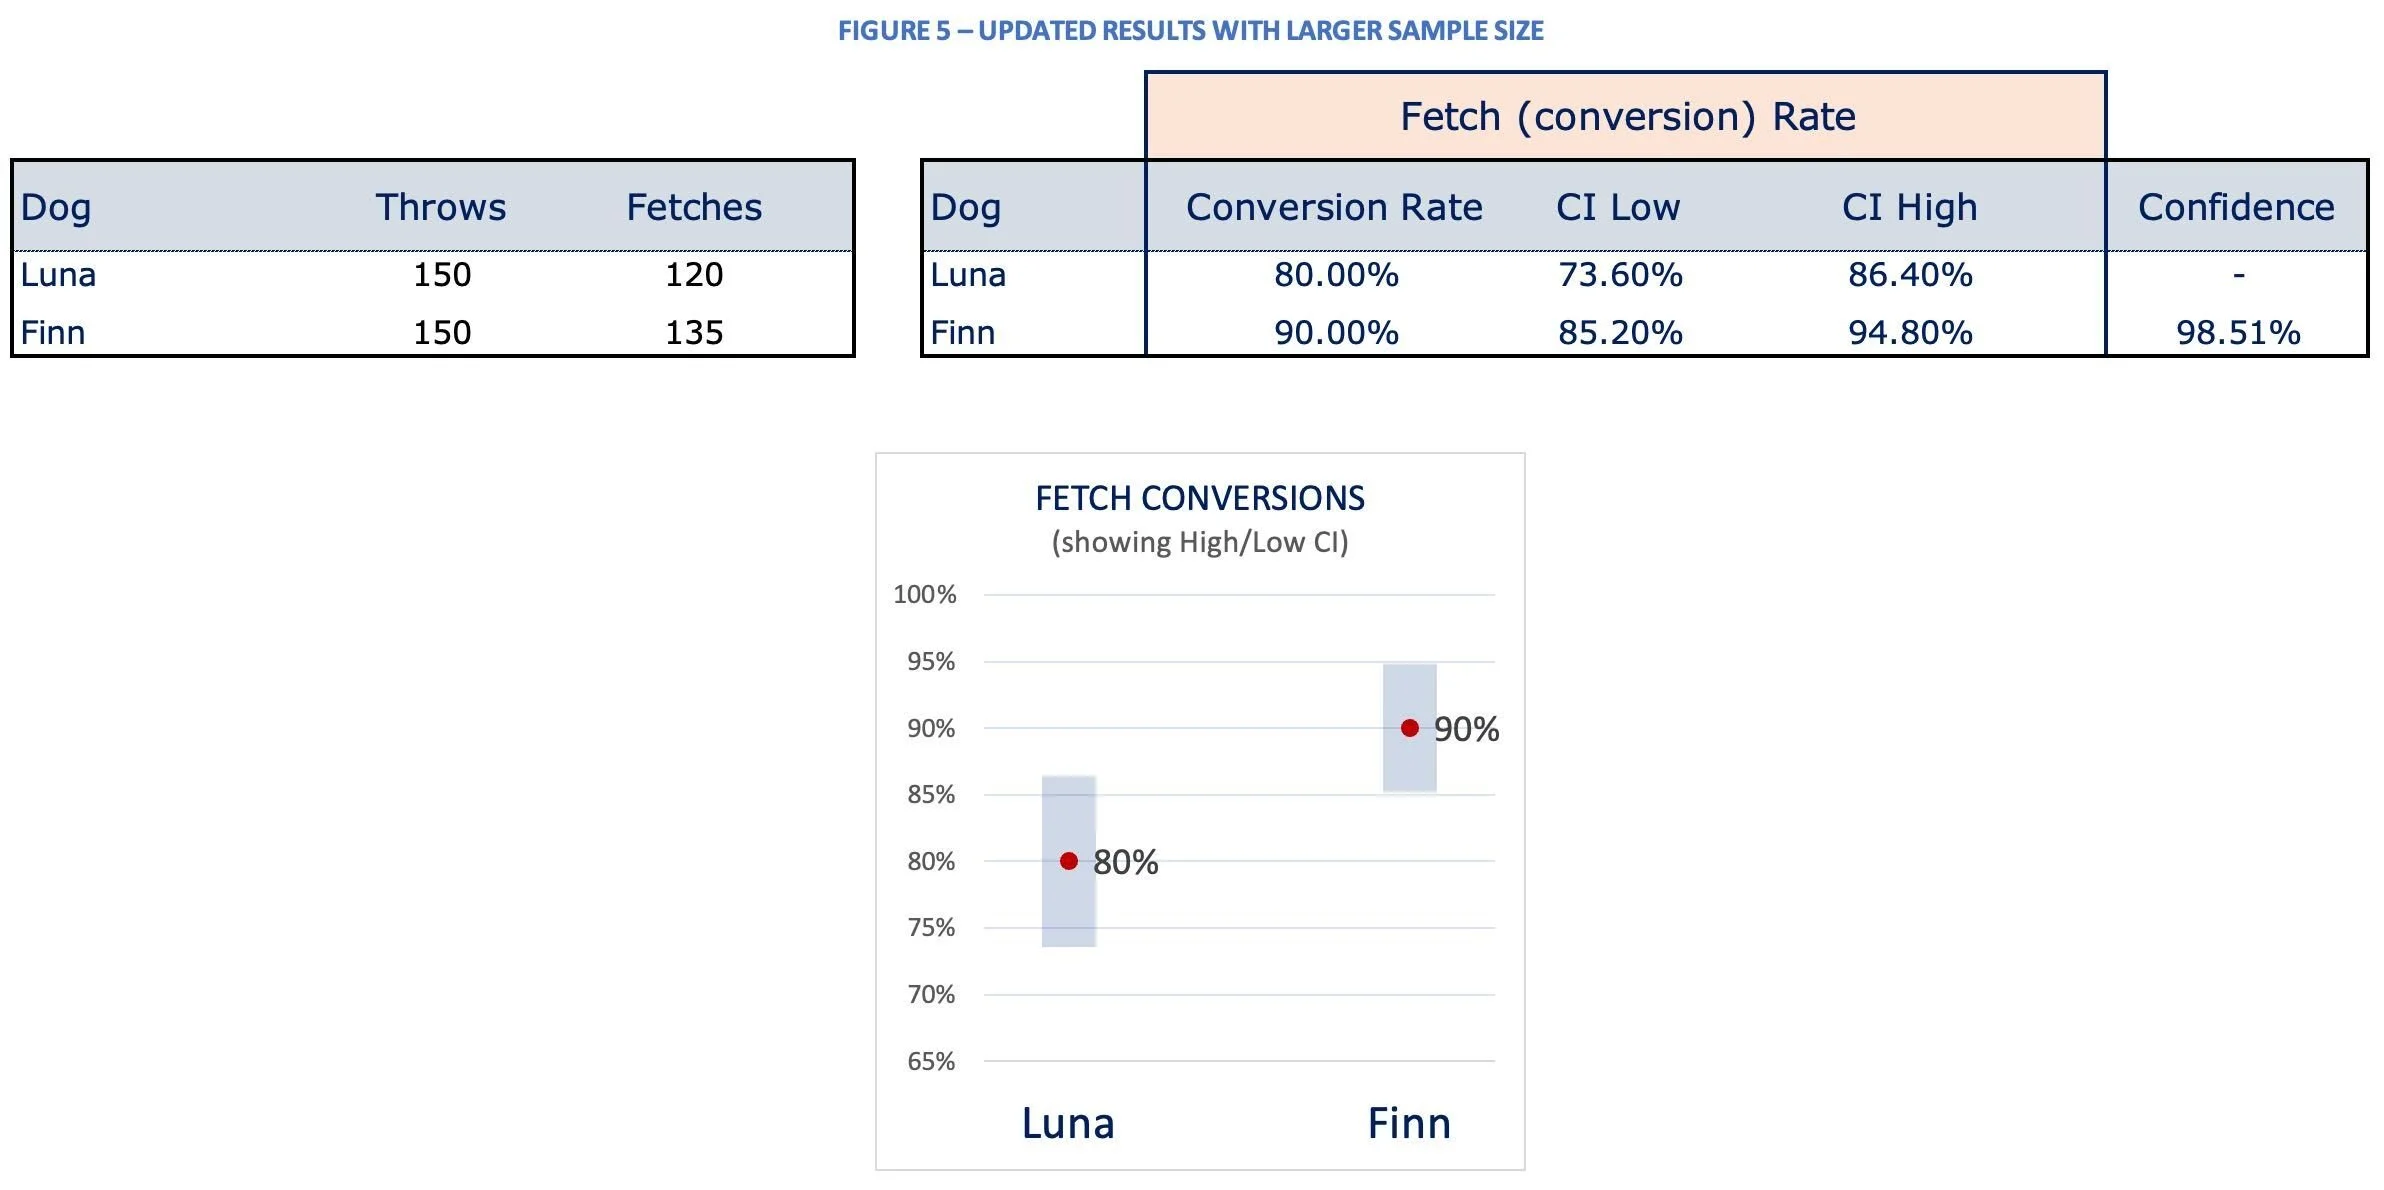
One way to attempt to get the confidence % above 95% is to increase our sample size. So, we decided to throw 50 more balls each to the dogs. Ahh, now look at what the data is showing in Figure 5 below. Our confidence is now at 98.51% and there is very little overlap between the confidence internals for each dog’s fetch rate. We high five and agree to enter Finn into next week’s competition. Wish us luck! Keep in mind Type I errors when running a test too long. As we discussed in a recent post around sample size calculations, you’ll want to run your test to the estimated test length from the sample size calculator.
What other topics can you think of to use in your A/B statistics story telling – music, food?? I hope this was helpful to you as you move along your Optimization journey. You now have a cool tool to help explain complicated statistics concepts and at the same time keep your audience engaged in what you are saying. When Senior Executives ask the questions after presenting the data for the A/B test results, you’ll quickly have an answer and you can make it fun too! (You don’t have to use dogs and fetching – I just happen to love Finn so much!). Happy testing!!